The word ‘data’ gets a bad rep. You probably feel a bit light headed just thinking of Excel-sheets with rows upon rows of numbers and arcane formulas.
But – there’s no way around it, data is getting more and more important. The growing digitalization of B2B marketing makes results measurable, and thus, auditable. A chance to get ever-closer to the bull’s eye.
So, do you have to deal with data? Well, of course you don’t have to do anything, but knowing how to decode data has many advantages. Steep learning curve? Maybe. But with the right techniques, you’ll be climbing in no time.
Our Media & Performance expert Vince can tell you how to become a master in data in just a few minutes!
From number soup to bite-sized insights
So, the amazing campaign you’ve been working on for months has finally started? Awesome! But… the real work is actually just beginning. LinkedIn, Facebook, your website, a newsletter or a QR-code on the DM… All those initiatives give you data. And data means insights. Insights to make adjustments to the campaign where needed.
Three fundamental principles create method in the madness.
1. A picture is worth a thousand Excel-sheets
What is true for words, is true for numbers. Take a look at the example below. Which channel generates most downloads? Nowhere near impossible to figure out, but it does require some extra legwork.
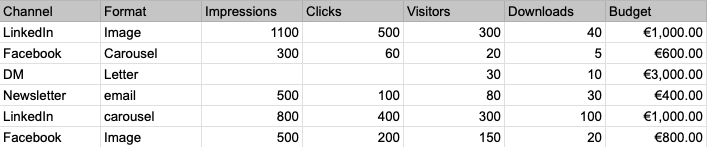
But what about a nice graph?
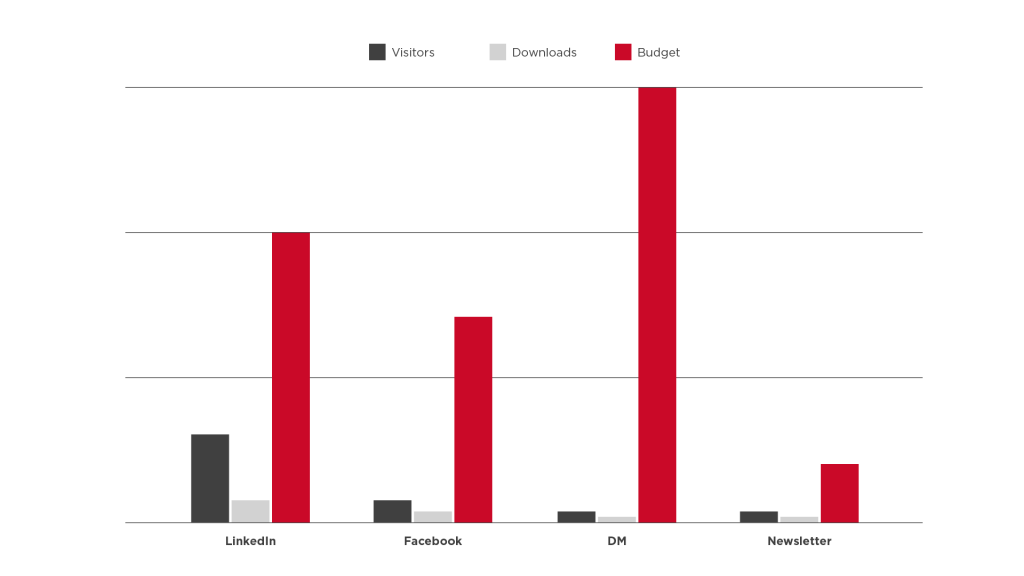
Here, one look is all it takes to see that LinkedIn is the most effective at securing downloads. Facebook is second, but you need quite a bit of budget. These are insights that paint a very useful picture when outlining your next steps.
2. Strength in numbers
Every channel has its own way of reporting. If you have to sift through all those interfaces, precious time is lost and the chance of mistakes grows. That’s why investing in a tool that centralizes and visualizes your data is so important. BBC uses Funnel.io, but there are lots of other options out there, such as Supermetrics or Whatagraph.
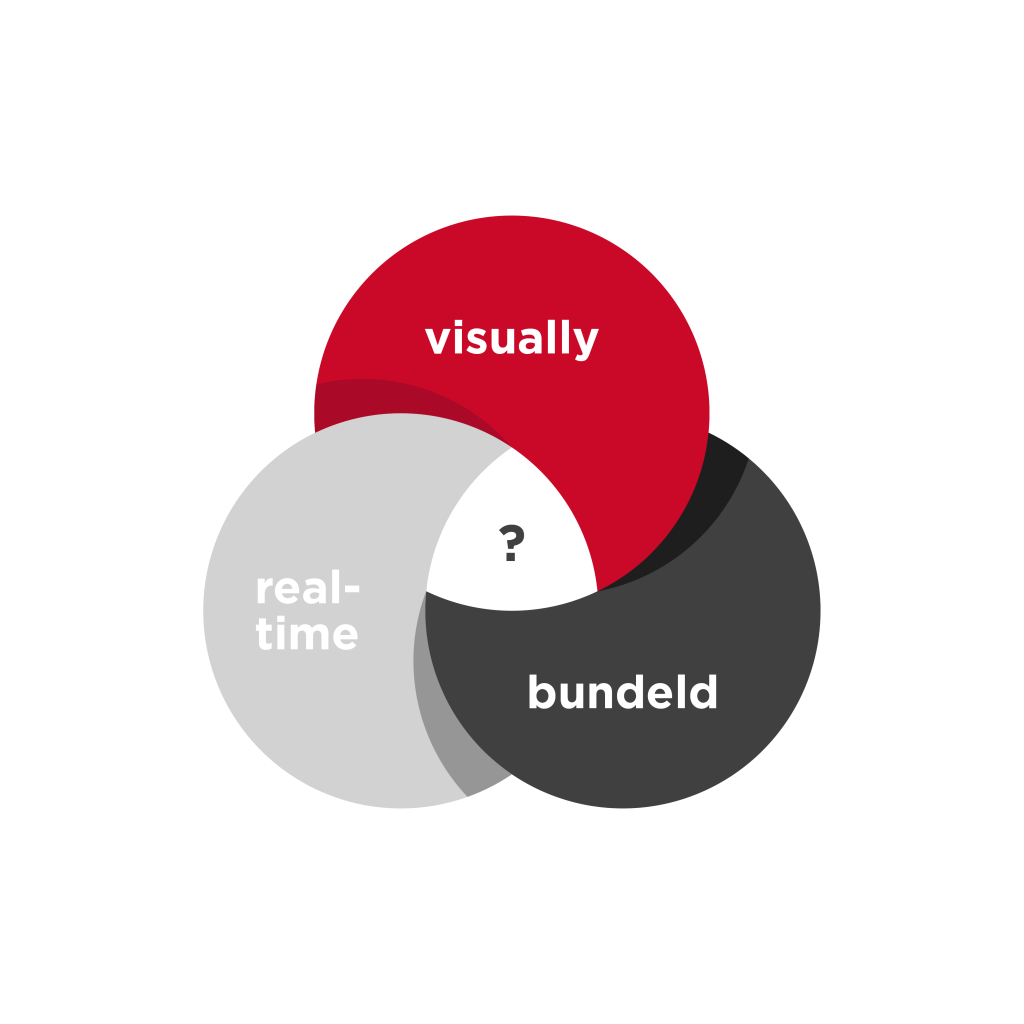
3. Make the info real-time
If you can find your data visually, all gathered in one place, your life will become a lot easier. But we can make it even better: making your information and data refresh automatically. Don’t want to make endless reports? Well, good news, you don’t have to anymore! Real-time data about your campaign, right at your fingertips, ready to check at any time (be warned, this can get addictive).
Your dashboards
So, what do you get when you combine all those tips? A dashboard. A place where you display, in real-time, the most important insights about your campaign, in the form of an easy to digest visual.So you can focus on making informed decisions, not on wrangling a sea of data.
Curious to learn how BBC handles their data? Eager to learn more or in need of advice to kick-start your own dashboards?